
Pavement Condition Index (PCI)
Effective infrastructure management begins with understanding the condition of your assets. For road networks, the gold standard for this assessment is the Pavement Condition Index (PCI). This powerful numerical indicator helps governments, municipalities, and engineering firms make data-driven decisions about maintenance, rehabilitation, and budgeting.
While asphalt pavements are designed for a typical useful life of approximately twenty years, harsh climate conditions and unregulated axle loads can cause distress to appear in as little as three to four years. This rapid deterioration makes proactive monitoring not just beneficial, but essential for preserving valuable infrastructure assets.
This comprehensive guide will break down everything you need to know about PCI, from its calculation to the advanced technology used to measure it.
What is Pavement Condition Index (PCI)?
The Pavement Condition Index (PCI) is a standardized, numerical rating between 0 and 100 used to quantify the surface condition of pavement assets. A PCI rating of 100 represents a perfect, newly constructed surface, while a score of 0 indicates a failed and impassable one. Acting as a universal “map” for infrastructure health, PCI translates complex visual and physical road data into a simple, objective number, enabling data-driven decision-making for engineers and asset managers.
Originally developed by the United States Army Corps of Engineers to evaluate airfield pavements, its effectiveness led to its adaptation for roadways. Today, it is the gold standard in transportation civil engineering and asset management, used by municipalities and agencies worldwide to measure performance, define levels of service, and communicate needs.
The methodology for conducting PCI surveys is rigorously documented and standardized by ASTM International to ensure consistency and reliability:
- ASTM D6433 – 20: Standard Practice for Roads and Parking Lots Pavement Condition Index Surveys
- ASTM D5340 – 20: Standard Test Method for Airport Pavement Condition Index Surveys
This standardized system is crucial because it empowers officials to:
- Prioritize maintenance and repair projects effectively across a vast network.
- Optimize limited budgets by focusing spending on the most critical needs.
- Forecast future pavement conditions and plan long-term investment strategies.
- Justify funding requests to stakeholders with concrete, quantifiable data.
Why is Pavement Condition Index Needed?
Managing road infrastructure effectively requires more than just fixing potholes; it demands a proactive strategy. The Pavement Condition Index (PCI) is the foundational tool that makes this possible. To understand its critical importance, we must first understand the relentless forces that cause pavement to fail and the severe consequences of that failure.
The Relentless Assault: Why Roads Deteriorate
Pavement is subjected to a constant barrage of destructive elements that work synergistically to accelerate its decline. The primary causes of deterioration include:[1]
- Traffic Loads: The repeated stress from heavy vehicles acts like a form of metal fatigue, gradually flexing the pavement until micro-cracks form, propagate, and lead to major structural failures like alligator cracking.
- Environmental Stress: Pavement endures extreme weather throughout its life. Freeze-thaw cycles expand cracks with ice, UV radiation and oxygen cause the asphalt binder to oxidize and become brittle, and extreme heat can soften pavements, leading to rutting under heavy loads.
- Subgrade Failure: The soil foundation beneath the pavement is its Achilles’ heel. Water infiltration weakens this base, and inadequate compaction during construction can lead to settling and instability, causing the surface above to fail.
- Material Aging: Simply put, pavement gets old. Over time, the asphalt binder loses its flexibility and elasticity through oxidation. This leads to age-related cracking across large areas, as the material can no longer handle the natural expansion and contraction from temperature changes without fracturing.
The High Cost of Neglect: Consequences of Poor Roads
Ignoring these deterioration factors leads to a cascade of negative impacts that extend far beyond the road itself, affecting everyone from daily commuters to the broader economy and environment[2]
- Skyrocketing Vehicle Operating Costs: Motorists bear a direct financial burden through premature wear and tear on tires, suspensions, and alignments, as well as increased fuel consumption due to the inefficiency of driving on rough surfaces.
- Compromised Public Safety: Damaged roads are dangerous roads. Potholes can cause loss of control, rutting can lead to hydroplaning, and cracked surfaces pose tripping hazards for pedestrians, creating a significant public liability.
- Negative Economic Impact: The condition of infrastructure is a key factor for business. Poor roads lead to longer freight delivery times, higher transportation costs for goods, and can make a region less attractive for new investment and development.
- Increased Environmental Footprint: The constant braking, accelerating, and increased rolling resistance on degraded roads lead to lower fuel efficiency across the entire vehicle fleet, unnecessarily increasing greenhouse gas emissions and a community’s carbon footprint.
In essence, the PCI is needed because it transforms this complex problem of deterioration and its costly consequences into an actionable, data-driven management plan.
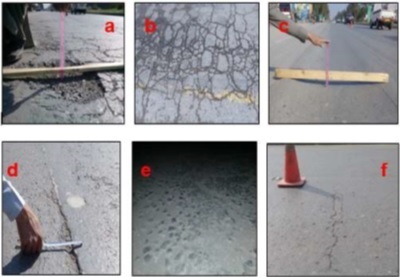
It is the first and most critical step in moving from reactive, costly repairs to proactive, budget-smart preservation. Pavement deterioration manifests in specific, recognizable forms, each telling a story about the environmental or structural stress that caused it. Cracking, rutting, potholes, and surface wear all serve as indicators of underlying problems, reflecting factors such as weathering, heavy traffic loads, poor drainage, and inadequate construction or maintenance practices
Common Road Deformities and Their Causes
Pavement deterioration manifests in specific, recognizable forms, each telling a story about the environmental or structural stress that caused it[3]
|
Distress Type |
What It Looks Like |
Primary Cause |
|
Alligator Cracking |
Interconnected cracks that resemble alligator skin. |
Structural failure due to overloading or weak subgrade. |
|
Block Cracking |
Interconnected cracks that form large, rectangular blocks (typically > 1 ft). |
Volume change of the asphalt concrete due to temperature cycles and hardening of the asphalt. Not traffic-related. |
|
Bumps and Sags |
Localized, abrupt upward (bump) or downward (sag) displacements in the pavement surface. |
Settlement or upheaval of the underlying soil or base material; often related to utility works or frost heave. |
|
Corrugations (Wash boarding) |
A series of closely spaced ridges and valleys (ripples) perpendicular to traffic. |
Instability of the asphalt mix or poor compaction under stop-and-go traffic or braking forces. |
|
Depressions |
Localized, shallow areas of pavement submerged below the surrounding surface. Can hold water. |
Improper construction compaction or settlement of the underlying utility trench backfill or base material. |
|
Edge Cracking |
Crescent-shaped cracks intersecting the pavement edge, typically within 1-2 feet. |
Lack of support at the pavement edge due to soil drying, erosion, or heavy vegetation. Often worsened by traffic. |
|
Joint Reflection Cracking |
Cracks in asphalt overlays that occur directly over underlying Portland Cement Concrete (PCC) joints. |
Movement of the underlying PCC slabs due to temperature changes and traffic loading. |
|
Lane/Shoulder Drop-Off |
A difference in elevation between the travel lane and the outside shoulder. |
Erosion or settlement of the shoulder base material. Creates a significant safety hazard. |
|
Low Ride Quality |
Not a specific distress, but a general term for a rough, bumpy ride. |
The combined effect of multiple distresses like cracking, potholes, patching, and roughness. |
|
Patching & Utility Cut Patching |
Areas where the original pavement has been removed and replaced, often with a different material. |
Result of repairing other distresses or excavating for utility installation. Quality depends on the repair work. |
|
Polished Aggregate |
The surface aggregates have been worn smooth, exposing the smaller, rounded stones. This creates a smooth, glossy, and slippery surface. |
Loss of the asphalt binder and fine aggregates from the surface due to traffic abrasion over time. |
|
Potholes |
Bowl-shaped holes of various sizes in the pavement surface. |
The progression of unchecked alligator cracking where pieces of pavement are dislodged by traffic. |
|
Rutting |
Longitudinal depressions in the wheel paths. |
Permanent deformation of the asphalt layer(s) or subgrade under repeated heavy loads. |
|
Raveling |
The disintegration of the pavement surface, exposing aggregates. |
Loss of bond between aggregate and asphalt binder due to aging or poor construction. |
|
Shoving |
A localized, longitudinal displacement of the pavement surface, creating a wave-like effect. |
Horizontal force from traffic braking or acceleration, combined with an unstable (often too rich) asphalt mix. |
|
Slippage Cracking |
Half-moon shaped cracks with the ends pointing in the direction of traffic. The surface material may be displaced. |
Lack of bonding between the surface layer and the course beneath it, pushed by braking or turning tires. |
|
Swelling |
A broad, gradual upward movement of the pavement surface over a large area |
Expansion of the subgrade soil, often due to moisture absorption in expansive clays. |
|
Transverse/ Longitudinal Cracking |
Cracks running across (transverse) or along (longitudinal) the road. |
Asphalt aging (becoming brittle) and temperature fluctuations causing shrinkage. |
|
Weathering and Raveling |
The disintegration of the pavement surface from the top down, exposing aggregates and making the surface rough. |
Loss of bond between aggregate and asphalt binder due to aging, poor mix design, or abrasion. |
|
Bleeding |
A shiny, black, sticky film on the pavement surface. |
Excess asphalt binder rising to the surface, often reducing skid resistance. |
PCI Categorization and Calculation
The Pavement Condition Index (PCI) provides a standardized framework for assessing pavement health, transforming complex survey data into a simple 0-100 score. This process involves two key aspects: interpreting the final score and understanding the rigorous method behind its calculation.
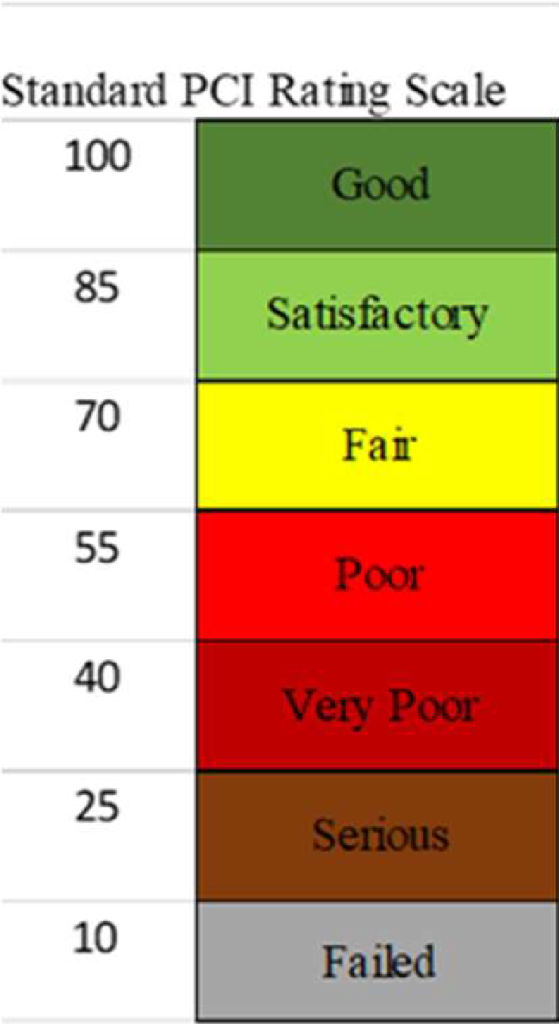
PCI Categorization: What the Score Means
The PCI score is divided into rating categories to simplify interpretation and prioritize actions. While exact ranges can vary by agency, a common classification is Figure 2:
Step 1: Sample Selection
For large networks, it’s impractical to survey every inch of pavement. The system is first divided into smaller sections called “sample units” (typically around 5000 sq. ft.). A representative number of these units are then selected for survey through a statistically sound method.
Step 2: Distress Identification & Quantification
A trained inspector surveys each sample unit and records:
- Distress Type: The specific kind of damage (e.g., alligator cracking, potholes, rutting).
- Severity Level: How advanced the distress is (Low, Medium, High).
- Quantity/Extent: The measurable amount (e.g., square feet of cracking, number of potholes, linear feet of rutting).
Step 3: Deduction Calculation & PCI Derivation
This quantitative data is then processed:
- Calculate Distress Density: The quantity of each distress is converted to a density value (e.g., percentage of the sample unit affected).
- Determine Deduct Values (DV): Using standardized tables or curves from ASTM, each distress type, severity, and density combination is assigned a “deduct value.” This value represents how much that specific flaw detracts from a perfect score.
- Compute Corrected Deduct Values (CDV): An iterative mathematical model is applied to account for the interaction of multiple distresses, resulting in a Corrected Deduct Value (CDV) for the sample unit.
- Calculate Sample Unit PCI: The PCI for the individual sample unit is finally calculated as: PCI = 100 – CDV.
- Determine Overall PCI: The overall PCI for the entire project (e.g., a full road or network) is computed as the weighted average of all the inspected sample units’ PCI values.
This process requires trained personnel to ensure accurate and consistent distress identification, which is critical for the resulting PCI to be reliable and actionable.
Pavement Treatment Strategies Based on PCI and Distress Type
Effective pavement management isn’t just about fixing problems—it’s about applying the right treatment at the right time. Using the Pavement Condition Index (PCI) and identifying the specific types of distress (age-related vs. load-related) are the most critical factors for selecting a cost-effective, long-lasting solution.
Preventive Preservation: The First Line of Defence
The most cost-effective strategy is to apply preventive treatments before significant cracking occurs. These treatments slow oxidation, restore flexibility, and seal the pavement surface, extending its life dramatically.
- Common Treatments: Slurry seals, chip seals, micro-surfacings, and fog seals.
- Optimal Timing: Typically applied every 5 to 12 years, depending on climate, asphalt quality, and traffic. The goal is to act before the onset of transverse and longitudinal cracking.
- The Goal of “Perpetual Pavement”: Pavements that receive timely, preventive preservation and avoid heavy overloading can potentially last for decades without needing major rehabilitation.
Corrective Treatments: Addressing Existing Damage
Once cracking appears, the chosen treatment must match the type and severity of the distress.
1. For Widespread Age-Related (Top-Down) Cracking:
- Scenario: Cracking is extensive but has not propagated deeper than 2 to 4 inches from the surface.
- Recommended Treatment: Partial-Depth Recycling (Cold In-Place Recycling). This process pulverizes the top layer of asphalt and mixes it with a recycling agent (like foamed asphalt or engineered emulsion). It is an efficient and sustainable solution that addresses the oxidized layer directly.
2. For Structural, Load-Related Failure:
- Scenario: The pavement shows widespread alligator (fatigue) cracking in the wheel paths, indicating a failure of the entire pavement structure or subgrade.
- Recommended Treatments:
- Structural Overlay or Inlay (“Mill-and-Fill”): Removing (milling) the damaged surface layer and replacing it with new asphalt. This is common for sections with moderate structural issues.
- Full-Depth Recycling: Pulverizing the full asphalt layer and underlying base, mixing it with a stabilizing agent, and compacting it to create a new, strong base. This is for severe structural failure.
- Complete Reconstruction: The most extensive option, involving full removal and replacement of the pavement and often the base material.
The timing and selection of treatments should be driven by your PCI data. By analyzing when distresses typically appear on your network, you can create a proactive preservation schedule that maximizes your budget and pavement lifespan.
The Relationship Between PCI and Roughness
To fully assess a road’s condition, managers rely on two key but different metrics: the Pavement Condition Index (PCI) and the International Roughness Index (IRI). Understanding their distinct purposes is crucial because they measure the impacts of different types of deterioration.
The PCI is a visual and structural index. It provides a comprehensive assessment of the pavement’s physical defects by cataloging:
- Distress Type: Is it a crack, a rut, or a pothole?
- Severity: How advanced is the damage (Low, Medium, High)?
- Extent: How much of the road is affected?
In essence, PCI answers the question: “What is wrong with the road, and how badly?” It is the primary tool for diagnosing the cause of a problem (e.g., age-related cracking vs. load-related fatigue) and planning the correct engineering treatment, such as a seal coat for surface aging or a structural overlay for base failure.
The IRI is a functional index. It measures the physical ride quality or smoothness of a road, which is what a driver or passenger actually feels. It is expressed in units of slope (in/mi or m/km), with a higher value indicating a rougher, more uncomfortable ride.
In essence, IRI answers the question: “How does it feel to drive on this road?” It directly correlates to user satisfaction, vehicle operating costs, and safety. A road with significant rutting or shoving will have a poor IRI because it creates an uneven driving surface.
Why You Need Both Metrics
The power of using both metrics together is revealed in their discrepancies:
- A road can have a Fair PCI but a Good IRI: A pavement with moderate age-related cracking might still provide a reasonably smooth ride, as the cracks haven’t yet created significant unevenness.
- A road can have a Poor IRI but a not-yet-Failed PCI: A road showing early but significant rutting—a major driver of roughness—will feel very rough to drive on long before its overall PCI score drops to “Failed.”
While PCI diagnoses the engineering problems and prescribes the right treatment, IRI measures the user experience. For a complete picture of pavement health—from structural integrity to driver satisfaction—both the PCI and IRI are vital, complementary tools.
PCI Measurement Devices: From Manual to Automated
Technology has dramatically evolved how we collect the data needed to calculate PCI.
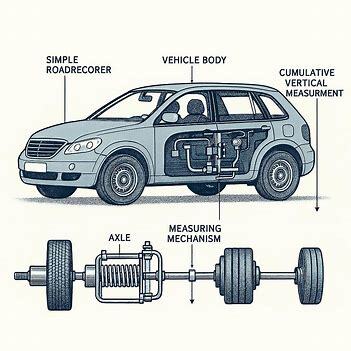
1. Bump Integrators
These are among the earliest automated devices. They measure the cumulative vertical motion of a vehicle’s axle relative to its body over a distance, providing a rough proxy for roughness. They are not directly used for PCI but are historical precursors to modern systems.
2. Accelerometer-Based Systems
These systems use highly sensitive accelerometers mounted on a vehicle to measure vertical acceleration. By processing this data (double integration), they can calculate the profile of the road, which can be linked to certain distress types like roughness or rutting.
3. Cell Phone-Based Systems
A rapidly growing field that uses the built-in sensors (accelerometers, GPS, cameras) in smartphones. While not yet as accurate as dedicated professional systems, they offer a highly scalable and cost-effective solution for preliminary network-level screening and citizen-reported data.
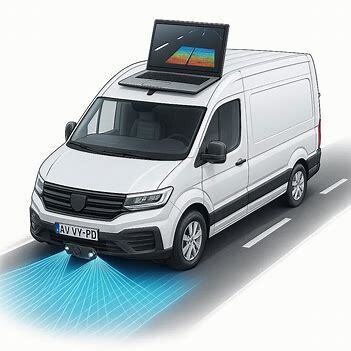
4۔ Laser-Based Systems
The current industry standard for high-precision data collection. Vehicles are equipped with arrays of high-speed lasers (profilometers) that scan the road surface at millimeter accuracy. They create detailed 3D digital models of the pavement, from which precise measurements of rutting, cracking, roughness, and even macro-texture can be automatically extracted by sophisticated software.
5. Vision-Based Systems
These systems use high-resolution cameras (often in stereo pairs) to capture continuous images of the road surface. Advanced artificial intelligence (AI) and machine learning algorithms then analyze these images to automatically detect, classify, and quantify distress types—effectively automating the manual survey process with incredible speed and consistency. Often used in conjunction with laser systems for a complete data picture.
References
- X. Zhu et al., “Effects of surface texture deterioration and wet surface conditions on asphalt runway skid resistance,” Tribol. Int., vol. 153, p. 106589, Jan. 2021, doi: 10.1016/j.triboint.2020.106589.
- Y. Qiao, Y. Guo, A. M. K. Stoner, and J. Santos, “Impacts of future climate change on flexible road pavement economics: A life cycle costs analysis of 24 case studies across the United States,” Sustain. Cities Soc., vol. 80, p. 103773, May 2022, doi: 10.1016/j.scs.2022.103773.
- A. Milling, H. Martin, and A. Mwasha, “Design, Construction, and In-Service Causes of Premature Pavement Deterioration: A Fuzzy Delphi Application,” J. Transp. Eng. Part B Pavements, vol. 149, no. 1, p. 05022004, Mar. 2023, doi: 10.1061/JPEODX.PVENG-1071.
See also
- LiDAR vs Radar vs Camera: The Sensor Trio Powering Intelligent Transportation – Intelligent Transportation Systems
- Edge Computing vs Cloud Computing: Differences & Applications – Intelligent Transportation Systems
- Intelligent Transportation Systems (ITS): Types, Technologies, Applications and Benefits – Intelligent Transportation Systems