
LiDAR vs Radar vs Camera: The Sensor Trio Powering Intelligent Transportation
Imagine a self-driving car navigating a complex urban intersection at night in drizzling rain. To make safe decisions, it needs to perceive its environment with superhuman precision and reliability. It does this not with one, but three primary “senses”: Vision (Camera), Sound (Radar), and Touch (LiDAR).
In the world of Intelligent Transportation Systems (ITS), there is no single perfect sensor. The magic lies in sensor fusion—the art of combining the unique strengths of LiDAR, Radar, and Camera technologies to create a robust, all-seeing perception system.
But what fundamentally distinguishes these sensors? At their core, they are devices that measure physical properties and transform them into signals for processing. However, they are divided into two key categories:
- Active Sensors (LiDAR, Radar): Emit their own energy (laser light or radio waves) and measure the reflected signal to calculate distance and properties.
- Passive Sensors (Cameras): Detect existing ambient radiation, such as sunlight or artificial light, to form a 2D image of the environment.
Although LiDAR and Radar share the same basic purpose as active sensors detecting the presence and volume of distant objects their underlying technologies create critical differences in performance.[1]
Light Detection and Ranging (LiDAR) is a light-based remote sensing technology. The principle is simple: point a focused infrared laser beam at a surface and measure the nanosecond-time it takes for the light to return. By using a rotating mirror or emitter to create a 360° field of view, a LiDAR sensor generates a massive 3D point cloud of its environment. Specialized software then translates this cloud into a precise digital replica of the surroundings, capturing every contour with centimeter-level accuracy.[2]
Radio Detection and Ranging (Radar) operates on a similar time-of-flight principle but uses radio waves instead of light. It transmits these waves from an antenna and analyzes the returning echo. The key differentiator is wavelength. Radar’s long wavelengths (30 cm to 3 mm) allow it to see through rain, fog, and dust over vast distances.[3] However, this comes at a cost: resolution. A standard radar’s resolution can be several meters at a 100-meter distance, limited by the antenna’s size.
In contrast, LiDAR’s micrometer-range wavelengths (e.g., 903-905 nm) are much shorter, enabling incredibly precise detail but making it more susceptible to weather. At 100 meters, a system like Yellowscan’s can achieve a resolution of just a few centimeters.
This is why LiDAR has become the gold standard for high-definition 3D mapping, laser altimetry, and detailed contour mapping. Radar, with its unparalleled all-weather reliability, is indispensable for aircraft anti-collision systems, air traffic control, and long-range detection. And cameras, the passive eyes, provide the crucial visual context needed to identify objects, read signs, and understand scenes.
How They Work: Core Principles
- Camera (Computer Vision): Cameras capture 2D images and videos, much like the human eye. Advanced AI and machine learning algorithms then analyze these images to identify objects, read signs, and interpret scenes. Their key weakness is the lack of innate depth perception, which requires complex software or multiple cameras (stereo vision) to estimate.
- Radar (Radio Detection and Ranging): Radar sensors transmit radio waves and analyze the reflected signals. They excel at measuring an object’s distance (range), relative speed (via the Doppler effect), and angle. Crucially, radio waves penetrate fog, rain, and dust, making Radar an all-weather champion. However, it produces low-resolution data, making it poor at identifying exactly what an object is.
- LiDAR (Light Detection and Ranging): LiDAR sensors pulse laser light (often infrared) millions of times per second and measure the time it takes for each pulse to return. This creates an incredibly precise, high-resolution 3D point cloud map of the environment, accurately capturing the shape and depth of every object. It is the master of detailed 3D mapping but can be hampered by heavy rain, fog, or snow.
Head-to-Head Comparison
The following table summarizes the key differences, highlighting why all three are necessary for a truly robust system.
|
Feature |
LiDAR |
Radar |
Camera (Vision) |
|
Primary Output |
High-res 3D Point Cloud |
Object range, velocity |
2D RGB Image |
|
Resolution |
Very High |
Low |
High (but 2D) |
|
Weather Performance |
Poor (fog, rain, snow) |
Excellent |
Poor (glare, low light) |
|
Range |
Long (≤250m) |
Very Long (≤300m+) |
Medium (≤150m) |
|
Speed Detection |
Good (from point cloud) |
Excellent (Directly) |
Good (requires AI) |
|
Object Classification |
Very Good (from 3D shape) |
Poor |
Excellent (from texture) |
|
Cost |
High |
Low |
Very Low |
|
Key Strength |
Precise 3D Mapping |
All-Weather Reliability |
Texture, Color, Context |
The choice between LiDAR, Radar, and Camera is a fundamental trade-off between resolution, contextual understanding, range, and reliability.
- Accuracy, Resolution & Context
- LiDAR: Utilizes laser light with a very short wavelength, allowing it to detect and map minuscule features with centimeter-level accuracy. It can pinpoint distances to within a few inches, making it superior for creating high-definition 3D maps and identifying the precise shape and size of objects in cluttered environments. However, it provides no color or texture data.
- Radar: Uses longer radio waves, which results in a lower spatial resolution. While modern advancements have improved precision, it generally cannot match LiDAR’s fine-grained detail. Its output is better for detecting the presence and speed of an object rather than its precise shape. It cannot classify objects based on visual features.
- Camera: Provides the highest resolution and rich contextual information. It is the only sensor that can read road signs, understand traffic light colors, interpret brake lights, and classify objects based on visual appearance (e.g., “pedestrian,” “dog,” “plastic bag”). Its critical weakness is that it captures 2D images; depth must be inferred using stereo vision or AI, which is computationally intensive and less precise than direct measurement.
- Range & Environmental Performance
- LiDAR: Offers a strong range of several miles under ideal, clear conditions. However, its primary weakness is a high sensitivity to atmospheric interference. Rain, fog, and snow can scatter and absorb laser light, drastically reducing its effective range and accuracy.
- Radar: Excels in both long-range detection and all-weather operation. Its longer wavelengths can penetrate rain, fog, and snow with minimal attenuation, allowing it to perform consistently in adverse conditions where LiDAR and cameras fail. Large radar systems can monitor objects hundreds of miles away.
- Camera: Performance is almost entirely dependent on ambient lighting and weather. It struggles severely with low light (night), glare (sunrise/sunset), and obscured vision (rain, snow, fog on the lens). Its effective range is typically limited to the field of view of its lenses and the clarity of the atmosphere.
- Data Output & Computational Load
- LiDAR: Outputs a precise 3D point cloud, which is a relatively straightforward dataset for an AI to process for spatial awareness. The computational load is high due to the density of the points but is manageable.
- Radar: Outputs a sparse set of data points containing range, velocity, and azimuth (angle). This is a very lightweight data stream that is easy to process in real-time, making it excellent for quick reactions.
- Camera: Outputs rich 2D image frames. This creates the highest computational burden, as complex Deep Neural Networks (CNNs) are required to parse every pixel for object detection, classification, and segmentation. This process is far more computationally expensive than processing LiDAR or radar data.
- Cost & Deployment
- LiDAR: Historically, LiDAR systems have been more expensive due to the cost of high-precision lasers and sensitive detectors. While prices are falling sharply with solid-state technology, it remains a premium sensor.
- Radar: Has a significant advantage in cost-effectiveness. Radar components are mature, cheap to produce, and the systems are less complex to operate and maintain. It is the most economical remote sensing technology.
- Camera: Is the cheapest sensor by far. Mass-produced for consumer markets, cameras offer an incredibly low-cost way to gather vast amounts of visual information. The main cost is not the hardware, but the immense computational power required to analyze the video feeds.
LiDAR: Types and Price, and Applications
LiDAR is often the most discussed and least understood sensor. Let’s break it down[4]
Types of LiDAR
- Mechanical Spinning LiDAR: The classic rotating sensor on top of early autonomous vehicles. Provides a full 360° field of view. The main drawbacks are high cost, larger size, and concerns about mechanical durability over time.
- Solid-State LiDAR (SS-LiDAR): The future of the technology. Has no moving parts, making it cheaper, more reliable, and compact enough to be embedded into vehicle body panels.
- Flash LiDAR: Illuminates the entire scene in a single, wide flash of laser light. Best for short-range applications.
- MEMS LiDAR: Uses tiny, silent micro-electrical-mechanical mirrors to steer the laser beam. Offers an excellent balance of range, resolution, and cost for automotive use.
LiDAR Price Comparison
Understanding cost is critical for ITS adoption. Prices are falling rapidly, especially for solid-state types.
|
LiDAR Type |
Typical Rang |
Approx. Cost (USD) |
Common Use Case in ITS |
|
Solid-State (Short-Range) |
< 50 m |
$100 – $500 |
Blind-spot monitoring, urban AVs |
|
Solid-State (Mid-Range) |
50 – 150 m |
$500 – $2,500 |
Highway autonomy, robotaxis |
|
Mechanical (Long-Range) |
150 – 250 m |
$5,000 – $20,000+ |
R&D, long-range mapping |
|
Drone-Mounted Survey |
100 – 500 m |
$15,000 – $60,000+ |
High-precision topography |
How Police Use LiDAR
You’ve likely encountered LiDAR without realizing it. Police use Laser LiDAR speed guns for traffic enforcement. Unlike traditional radar, which uses a wide radio wave beam, LiDAR speed guns emit a highly focused, narrow beam of infrared light. An officer must aim it precisely at a specific vehicle (like targeting with a rifle). The device calculates speed by measuring the change in the reflected laser light’s frequency (Doppler shift). This precision makes it harder to detect with standard “radar detectors,” leading to the need for specialized “laser jammers”.
LiDAR Applications in ITS
- Autonomous Vehicles (AVs): The primary application, providing the precise 3D environmental data needed for safe navigation.
- Advanced Driver-Assistance Systems (ADAS): Enabling features like adaptive cruise control, automatic emergency braking (AEB), and lane-keeping assist.
- Traffic Monitoring & Infrastructure: Sensors mounted on poles or gantries can monitor traffic flow, classify vehicle types (car vs. truck), detect incidents, and optimize traffic light timing in real-time.
- High-Definition (HD) Mapping: Creating centimeter-accurate maps of roadways. AVs use these maps to know exactly where they are, down to the lane markings.
Drone-Based LiDAR Survey: A Game Changer
Drone-based LiDAR is revolutionizing large-scale infrastructure planning and monitoring. A drone equipped with a LiDAR sensor and precise GPS can quickly and safely map vast areas of land[5]
- ITS Applications:
- Highway & Railway Corridor Mapping: Planning new routes, monitoring for landslides or erosion, and conducting infrastructure inspections without costly road closures.
- Construction Site Progress Monitoring: Accurately tracking earthmoving volumes and ensuring projects are on schedule.
- Urban Planning: Generating highly accurate 3D digital twins of cities to simulate traffic patterns, plan for flooding, and design smarter urban mobility solutions.
- Benefits: Drone LiDAR is faster, safer (no survey crews on active roads), and provides exponentially more data points than traditional ground-based surveying methods.
The Inevitable Power of Sensor Fusion
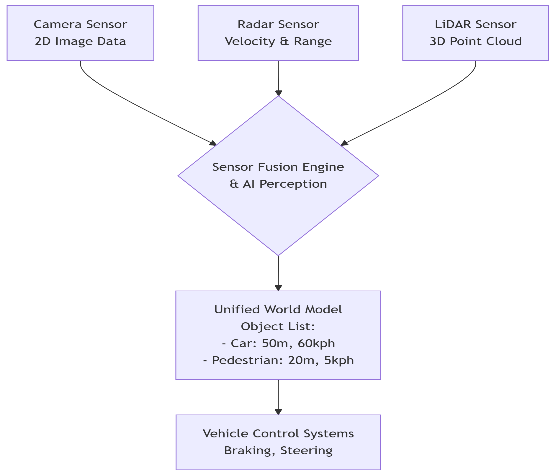
Relying on a single sensor is a gamble that autonomous systems cannot afford. The true breakthrough in perception lies not in the sensors themselves, but in sensor fusion—the advanced process of intelligently integrating data from LiDAR, radar, cameras, and ultrasonic sensors to create a single, accurate, and reliable model of the world.
This multi-sensor approach is the industry standard for a critical reason: each technology compensates for the others’ weaknesses. Modern autonomous vehicles employ a suite of these sensors, each acting as a unique data-gathering organ. Sophisticated AI algorithms then fuse these disparate data streams, cross-validating information to build a robust understanding of the environment that is far greater than the sum of its parts.
Consider this scenario: A vehicle approaches a debris-filled road.
- The camera identifies a dark, flat shape on the asphalt, suggesting it could be a lost tire.
- The radar detects a stationary object and confirms its precise velocity (0 km/h), but cannot determine its shape or size.
- The LiDAR sensor pinpoints the object’s exact location and constructs a detailed 3D point cloud, revealing the object’s cylindrical shape and precise dimensions.
Fused together, this collective intelligence allows the AI to make a high-confidence decision: “This is a tire, 50 meters away, posing a collision risk.” It can then execute a safe lane change or braking maneuver. Without fusion, each sensor alone provides only a fragment of the truth, leading to potential uncertainty or failure.
Conclusion: A Collaborative Future
The quest for perception is not a winner-take-all battle between sensors. It is a strategic collaboration where each technology plays an irreplaceable role:
- LiDAR provides the definitive precise, high-resolution 3D map of the environment.
- Radar delivers all-weather reliability and direct velocity measurement, unaffected by visual obstructions.
- Cameras offer rich visual context and classification, essential for reading signs, recognizing traffic lights, and understanding scenes.
The trajectory of the industry is clear: as solid-state LiDAR prices fall and AI-powered computer vision becomes more sophisticated, the fusion of these technologies will only deepen. This collaborative sensing suite not any individual component is the true foundation upon which safer, more efficient, and truly intelligent transportation systems are being built. It is this synergy that steadily propels us toward a future of seamless and autonomous mobility.
References
- I. Bilik, “Comparative Analysis of Radar and Lidar Technologies for Automotive Applications,” IEEE Intell. Transp. Syst. Mag., vol. 15, no. 1, pp. 244–269, Jan. 2023, doi: 10.1109/MITS.2022.3162886.
- I. Kim et al., “Nanophotonics for light detection and ranging technology,” Nat. Nanotechnol., vol. 16, no. 5, pp. 508–524, May 2021, doi: 10.1038/s41565-021-00895-3.
- A. Emmanuel Onoja, “Embedded System Based Radio Detection and Ranging (RADAR) System Using Arduino and Ultra-Sonic Sensor,” Am. J. Embed. Syst. Appl., vol. 5, no. 1, p. 7, 2017, doi: 10.11648/j.ajesa.20170501.12.
- X. Wang, H. Pan, K. Guo, X. Yang, and S. Luo, “The evolution of LiDAR and its application in high precision measurement,” IOP Conf. Ser. Earth Environ. Sci., vol. 502, no. 1, p. 012008, May 2020, doi: 10.1088/1755-1315/502/1/012008.
- H. A. Orengo, A. Garcia‐Molsosa, I. Berganzo‐Besga, J. Landauer, P. Aliende, and S. Tres‐Martínez, “New developments in drone‐based automated surface survey: Towards a functional and effective survey system,” Archaeol. Prospect., vol. 28, no. 4, pp. 519–526, Oct. 2021, doi: 10.1002/arp.1822.